Recent changes to this page have not yet been reviewed by moderators
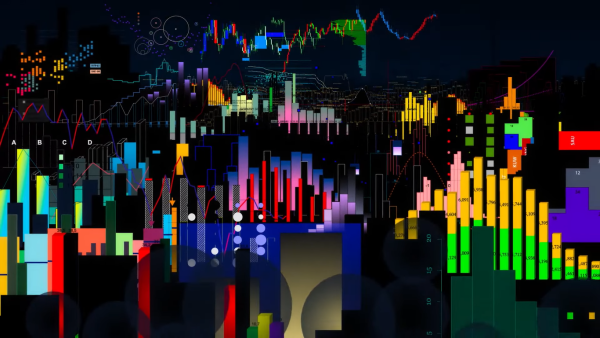
During a PowerPoint presentation, statistical diagrams are breaking free from the strait-jacket of their coordinates. A trip into the sensual world of statistics begins. Pie charts are melting, arrow diagrams twisting, scatter plots, bar graphs and stock market curves join in a collective climax.
Images (2)

Directed by
Maja GehrigScreenings and awards
2020
 The Equilibristics Prize